Will it snow this winter? NOAA's outlook cannot say — here is what it can
NOAA's seasonal outlook does not forecast snowfall, and the reason is built into how it measures precipitation. It gives El Nino a 97 per cent chance of lasting into spring and tilts the odds wet in the south, dry in the northwest.
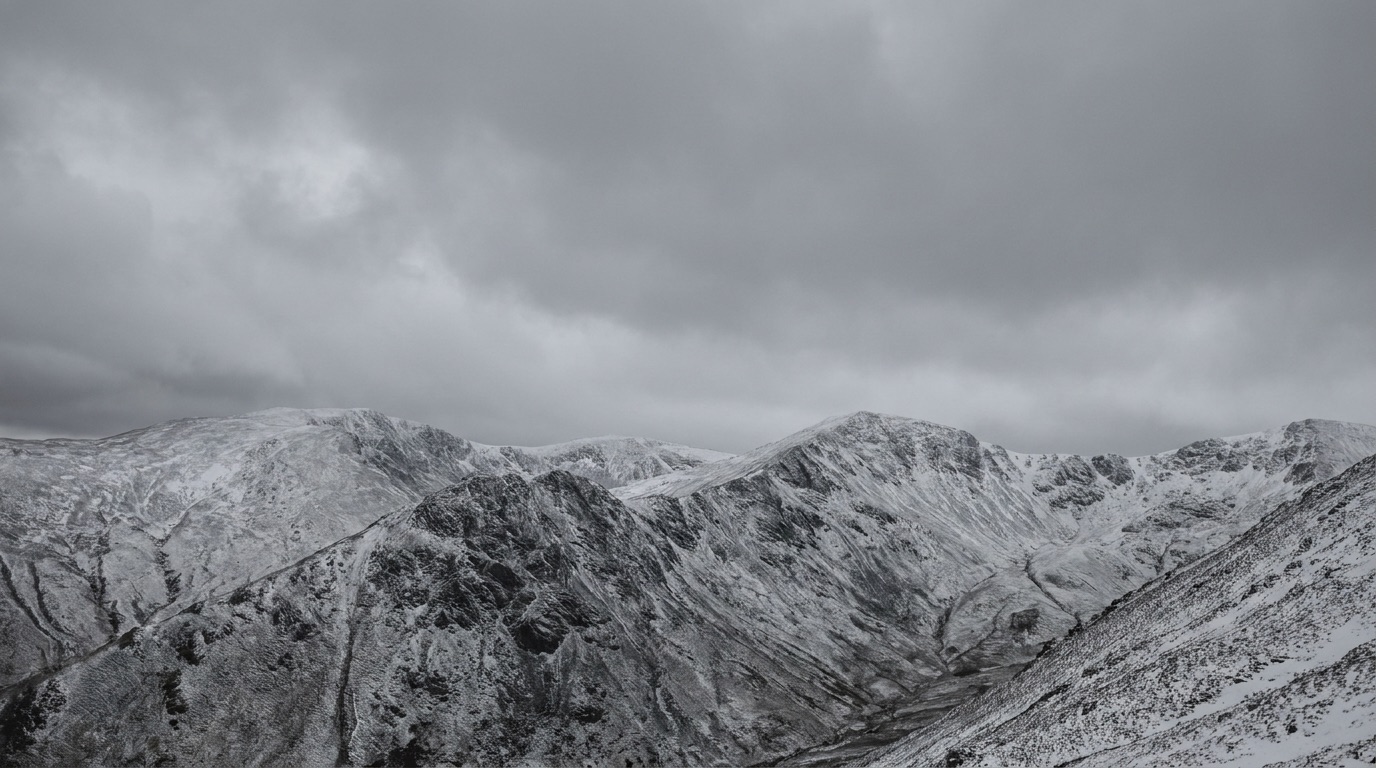
If you arrived here wanting to know how much snow is coming, the honest answer is that NOAA's winter outlook does not tell you, and it is not supposed to. Its precipitation maps combine rain and melted snow into a single measure and cannot say which of the two will fall in any given place. That limitation is built into the product, not an oversight in it. What the outlook does offer is a read on the odds for your region, and this year it carries an unusually confident number.
The seasonal winter outlook issued by NOAA's Climate Prediction Center on 16 July carries an unusually confident number in it. Forecasters put the odds of El Niño continuing into early spring 2027 at 97 per cent, and the odds of it reaching very strong intensity between October and December at 81 per cent.
El Niño is a warming of the central and eastern tropical Pacific that shifts where the jet stream sits. When it is strong, the storm track tends to run further south across North America than it otherwise would. That single mechanism explains most of what the outlook says.
The regions favoured for above-normal precipitation form a band across the southern half of the country: Southern California and parts of the Sierra Nevada, Arizona, New Mexico, southern Colorado and Utah, the southern Plains, the Gulf Coast, the Southeast and the eastern United States.
The regions favoured for below-normal precipitation are the mirror image, sitting to the north: the Pacific Northwest, northern Idaho, Montana, Wyoming and the northern Plains.
Temperatures lean above normal across much of the West, the northern tier, the East Coast and Alaska. The central and southern interior is given equal chances of above, near or below normal, which is the outlook's way of saying the signal there is not strong enough to call.
What the outlook does not say is the part most readers want, and the caveats are worth taking literally rather than skimming. It does not predict snowfall totals. Precipitation in these maps combines rain and melted snow, and the outlook cannot say which one will fall in a given place. It does not predict individual storms, which are not forecastable at this range. And a lean toward above-normal temperatures does not rule out major snowstorms or Arctic outbreaks; a warm season average and a severe cold snap are entirely compatible.
One further detail is easy to miss. This particular outlook covers January through March 2027 and does not include December 2026, so the first month of what most people would call winter sits outside it.
There is a further limit that applies to every seasonal outlook, not just this one. These maps express probabilities relative to a thirty-year normal, so a region shaded for above-normal precipitation is not being promised a wet winter; it is being told the odds have tilted. A season can land in the unfavoured third of the distribution without the forecast having been wrong, which is a distinction that survives poorly in headlines.
Two words worth clearing up, because both send people to this page.
**"Super El Niño"** is not a NOAA classification. The official scale tops out at "very strong", which is the category the 81 per cent figure above refers to. "Super" is media shorthand for events at the high end of that range, and it carries no defined threshold — so when you see it, check whether a number is quoted alongside it.
**The Farmers' Almanac** publishes regional winter forecasts months ahead, including snowfall totals. NOAA does not, and the difference is not caution. Seasonal snowfall forecasting has very little demonstrated skill, which is why the Climate Prediction Center issues probability tilts for precipitation and temperature and stops there. The two are not rival forecasts of the same thing; one is making a claim the other has decided the evidence does not support.
The practical reading is narrow but real. A southern-shifted storm track raises the odds of a productive season for the southern half of the western mountains and raises drought and fire concerns for the Pacific Northwest and northern Rockies. Those are shifts in probability across a season, not a schedule. Anyone making a decision that depends on a particular week of weather will still be waiting on forecasts issued days ahead, not months.
So where does a snow answer come from? For a specific storm, from National Weather Service forecasts issued days ahead — that is the range at which snowfall becomes predictable at all. For the season as a whole, it largely does not exist: seasonal snowfall forecasting has very little demonstrated skill, which is precisely why NOAA declines to publish one. Maps promising winter snowfall totals by region are going beyond what the underlying science supports, whoever is publishing them.
Key takeaways
See full context →NOAA gives El Nino a 97 per cent chance of persisting into spring 2027, favouring a wet south and a dry Pacific Northwest.
The probability figures, regional signals and issue date come from the Climate Prediction Center's own outlook.
The outlook covers January to March 2027 only and says nothing about snowfall totals or individual storms.
Source map
Explore all sources →✓What we know
- NOAA's Climate Prediction Center issued the outlook on 16 July 2026, covering January to March 2027.
- El Nino is given a 97 per cent chance of continuing into early spring 2027.
- There is an 81 per cent chance of very strong intensity between October and December 2026.
- Above-normal precipitation is favoured across the southern tier and the eastern United States.
- Below-normal precipitation is favoured for the Pacific Northwest, northern Rockies and northern Plains.
?What remains unclear
See full context- The outlook does not forecast snowfall totals, because it cannot say whether precipitation falls as rain or snow.
- Individual storms are not forecastable at this range and are not part of the outlook.
- December 2026 falls outside the period this outlook covers.
- 'Super El Niño' has no official definition; NOAA's top category is 'very strong'.
Every factual claim, and what supports it
Each statement in this article is listed with how it is classified and which of the sources below establish it. A verified fact is corroborated by two or more independent sources; a reported claim rests on fewer, or on a single party’s account.
NOAA's Climate Prediction Center issued a winter outlook on 16 July 2026 covering January to March 2027.
Issue date and scope reported by the specialist outlet.El Nino is given a 97 per cent chance of continuing into early spring 2027.
Probability figure from the outlook.There is an 81 per cent chance of very strong intensity between October and December 2026.
Probability figure from the outlook.Above-normal precipitation is favoured across the southern tier and eastern United States.
Regional signals listed in the outlook.Below-normal precipitation is favoured for the Pacific Northwest, northern Rockies and northern Plains.
Regional signals listed in the outlook.Seasonal outlooks combine rain and melted snow and do not forecast snowfall totals.
Stated by the agency and echoed in independent explanations of how the maps work.Individual storms cannot be forecast at seasonal range.
Caveat stated in the outlook and in independent coverage.A strong El Nino shifts the North American storm track southward.
The mechanism underlying the regional signals, described in both sources.Above-normal seasonal temperatures do not preclude major snowstorms or Arctic outbreaks.
Caveat stated alongside the temperature outlook.A southern-shifted track raises drought and fire risk for the Pacific Northwest and northern Rockies.
A consequence implied by the precipitation signal; neither source states it as an agency finding.NOAA's seasonal outlook does not forecast snowfall because its precipitation maps combine rain and melted snow.
Stated limitation of the Climate Prediction Center's seasonal precipitation product.'Super El Niño' is not a NOAA classification; the official top intensity category is 'very strong'.
NOAA's published intensity categories do not include the term.
How the story developed
- Early season previews begin circulating.
- NOAA's Climate Prediction Center issues the January to March 2027 outlook.
- The window in which El Nino is given an 81 per cent chance of reaching very strong intensity.
- The period the outlook actually covers.
Why this framing matters
Seasonal outlooks are routinely reported as snow forecasts, which is precisely what they are not. The agency states plainly that its maps combine rain and melted snow and cannot resolve individual storms. This summary leads with the mechanism and the probabilities, and gives the caveats the same weight the agency does rather than burying them.
5 sources reviewed
Every source used in this summary, grouped by its role in the reporting chain.
- 1NOAA Climate Prediction Center (via Unofficial Networks)Independent · 2026-07-19Independent
- 2NOAAPrimary · 2025Primary
- 3CBS NewsIndependent · 2025Independent
- 4OpenSnowIndependent · 2025Independent
- 5Unofficial NetworksBackground · 2026-07-15Background
How we verified this story
Built around the Climate Prediction Center's July outlook as reported by a specialist outlet, with an official NOAA release and two further independent reports used to check how seasonal outlooks are framed and what they can support. The probability figures, regional signals and the January to March scope come from the outlet's account of the July outlook. The NOAA map product itself was not retrieved directly, and the reference releases describe an earlier season, so they are cited for method rather than for this season's numbers.
Updates and corrections
Preview page created.
Source context and unresolved questions updated.
Related stories and more context
 BUSINESS
AI capex in 2026: the headline totals range from $630bn to $800bn, and the gap is who gets counted
Published estimates for hyperscaler AI spending this year differ by nearly $200 billion. The disagreement is not about the companies' plans — it is about how many companies are in the set, and which baseline year the growth is measured from.
 SCIENCE
Does El Niño mean more snow? Seasonal outlooks cannot answer that, and here is why
The maps people check for a snow answer measure precipitation, which combines rain and melted snow into one number. They cannot separate the two. That is a built-in limitation of the product, not a gap someone forgot to fill.
 TECHNOLOGY
Will AI take my job? The measured effect is real, narrow, and concentrated on people under 26
The clearest evidence so far comes from payroll records, not forecasts. It shows a 16 per cent relative employment decline for 22- to 25-year-olds in the most exposed occupations — and growth where AI augments the work instead of replacing it.
Join the discussion
Help build a clearer picture. Add context, challenge a claim or share a source.