Does El Niño mean more snow? Seasonal outlooks cannot answer that, and here is why
The maps people check for a snow answer measure precipitation, which combines rain and melted snow into one number. They cannot separate the two. That is a built-in limitation of the product, not a gap someone forgot to fill.
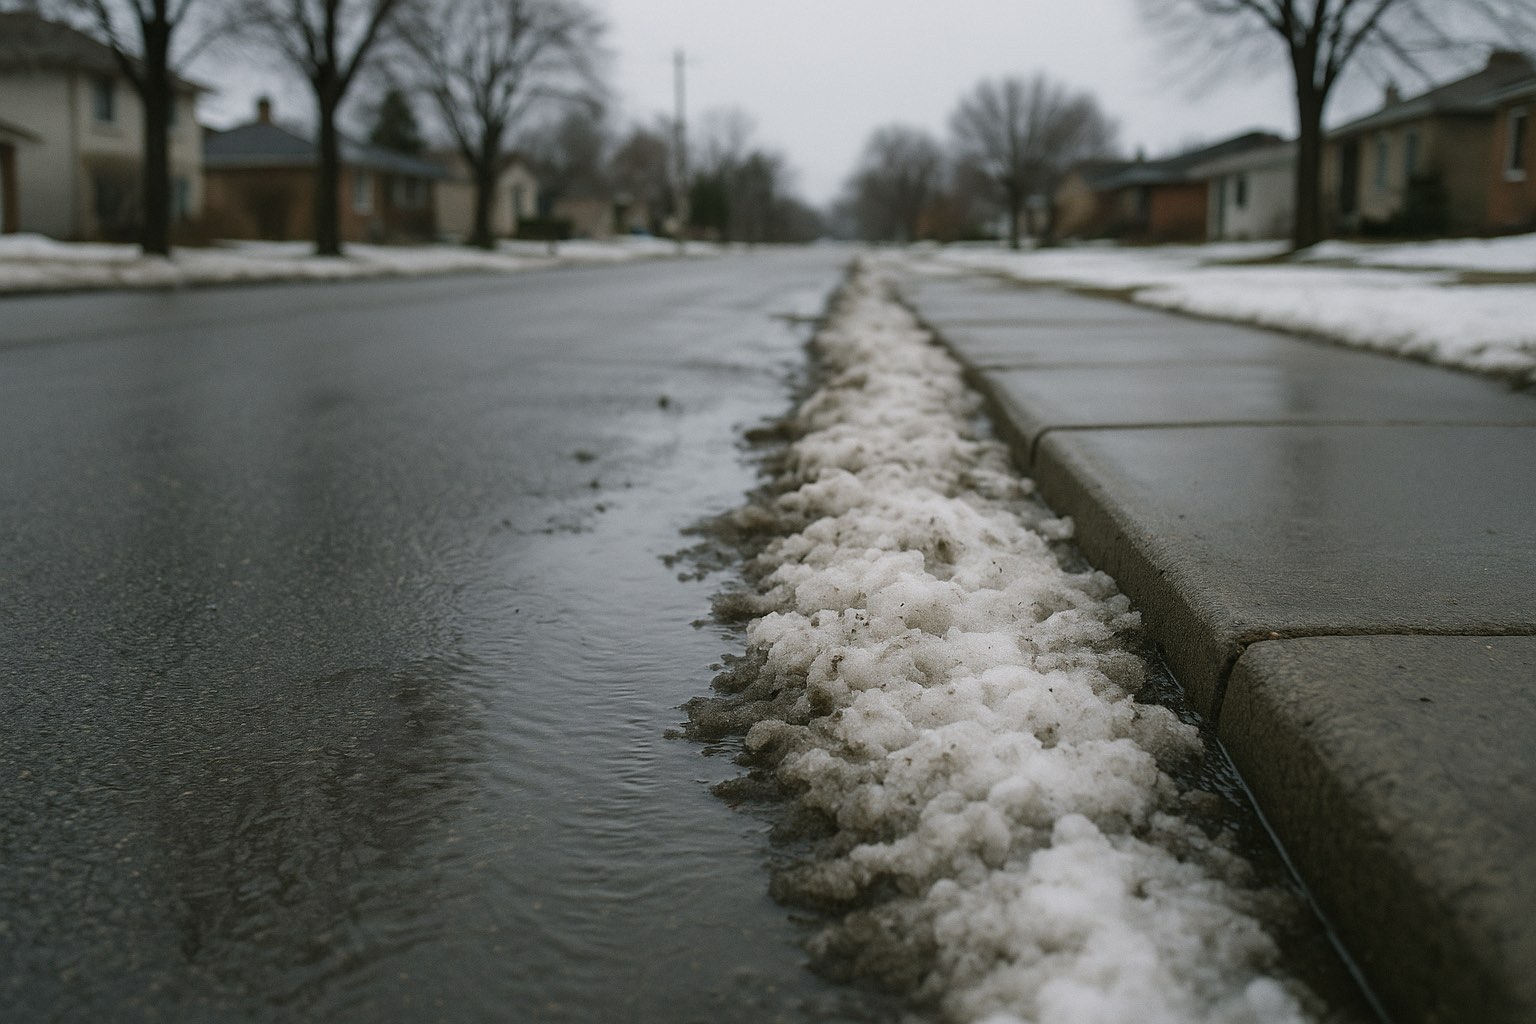
No — and more usefully, the question cannot be answered by the thing most people check to answer it.
Seasonal outlooks from NOAA's Climate Prediction Center map **precipitation**, and precipitation is a single measure that combines rain and melted snow. A map showing above-normal precipitation odds for your region is telling you more water is likely to arrive. It is not telling you what form it arrives in, because the measure does not distinguish. That is built into the product rather than missing from it.
So a region can be shaded wet and get rain. A region shaded dry can still get a heavy snow event. Neither outcome makes the outlook wrong, because the outlook was never making a snowfall claim.
There is a concrete reason the conversion cannot be done. Precipitation is recorded as liquid-water equivalent — whatever fell, measured as if melted. Turning that back into snow depth requires a snow-to-liquid ratio, and that ratio is not a constant. A rough rule of thumb puts it near 10 to 1, meaning ten inches of snow from an inch of liquid, but in practice it swings widely with temperature and the structure of the snowflakes. Cold, dry snow can exceed 20 to 1. Wet snow near freezing can be closer to 5 to 1.
That means an identical precipitation figure can produce four times as much snow depth in one storm as another, in the same place, in the same month. The outlook does not know which one is coming, because the ratio depends on conditions that are only knowable days ahead. Publishing a seasonal precipitation map and converting it to inches of snow requires assuming a ratio nobody can justify at that range.
There is a second limitation stacked on top. Seasonal outlooks express **probabilities across a whole season**, not conditions on any day. A region favoured for above-normal precipitation is being told the distribution has tilted, not that the season will be wet. A season can land in the unfavoured third without the forecast having failed. Individual storms are not forecastable at seasonal range at all.
And a third, which catches people out every winter: a lean toward above-normal temperatures does not rule out major snowstorms or Arctic outbreaks. A warm seasonal average and a severe cold snap are entirely compatible. The average is an average.
What El Niño does do is shift the storm track. In a strong event it tends to run further south across North America, tilting the odds wetter across the southern tier and drier across the Pacific Northwest and northern Rockies. Whether that additional moisture falls as snow in any particular place depends on temperature at the time, elevation, and the individual storm — none of which a seasonal outlook resolves.
As of the Climate Prediction Center's diagnostic discussion dated 9 July 2026, an El Niño Advisory is in effect with the Niño-3.4 index at +1.2 °C, and forecasters give 81 per cent odds of very strong intensity during October to December.
So where does a snow answer come from? For a specific storm, from National Weather Service forecasts issued days ahead — that is the range at which snowfall becomes predictable at all. For a whole season, largely nowhere: seasonal snowfall forecasting has very little demonstrated skill, which is precisely why NOAA does not publish one. Maps promising regional winter snowfall totals are going beyond what the underlying science supports, whoever is publishing them.
Key takeaways
See full context →Seasonal outlooks map precipitation, which combines rain and melted snow and cannot separate them.
A warm seasonal average does not rule out major snowstorms; the two are compatible.
Snowfall becomes predictable at a range of days, not months — which is why NOAA publishes no seasonal snow forecast.
Source map
Explore all sources →✓What we know
- NOAA seasonal outlooks map precipitation, which combines rain and melted snow into a single measure.
- Precipitation is recorded as liquid-water equivalent, and converting it to snow depth requires a snow-to-liquid ratio that varies with temperature.
- The outlooks express probabilities across a season rather than conditions on any given day.
- A lean toward above-normal temperatures does not rule out major snowstorms or Arctic outbreaks.
- A strong El Niño tends to shift the storm track south, tilting odds wetter across the southern tier.
- An El Niño Advisory was in effect with Niño-3.4 at +1.2 °C as of the CPC discussion dated 9 July 2026.
?What remains unclear
See full context- The snow-to-liquid ratio for any future storm is not knowable at seasonal range, so no conversion from a precipitation outlook is defensible.
- Whether additional moisture falls as snow in a given place depends on temperature, elevation and the individual storm, none of which seasonal outlooks resolve.
- Seasonal snowfall forecasting has very little demonstrated skill and NOAA publishes no such product.
- Individual storms are not forecastable at seasonal range.
- A season can fall outside the favoured range without the outlook having been wrong.
Every factual claim, and what supports it
Each statement in this article is listed with how it is classified and which of the sources below establish it. A verified fact is corroborated by two or more independent sources; a reported claim rests on fewer, or on a single party’s account.
NOAA seasonal outlooks map precipitation, combining rain and melted snow into one measure.
Stated limitation of the seasonal precipitation product.The outlooks express seasonal probabilities rather than conditions on a given day.
Probabilistic framing stated by NOAA.A lean toward above-normal temperatures does not rule out major snowstorms or Arctic outbreaks.
Caveat stated with the seasonal outlook.A strong El Niño tends to shift the US storm track south.
Tendency across past events.An El Niño Advisory was in effect with Niño-3.4 at +1.2 °C as of 9 July 2026.
From the dated official discussion.Seasonal snowfall forecasting has very little demonstrated skill and NOAA publishes no such product.
The absence of the product and its stated reason.Precipitation is measured as liquid-water equivalent, and the snow-to-liquid ratio varies widely with temperature rather than being constant.
Standard measurement practice; the ratio is commonly approximated near 10:1 but ranges roughly from 5:1 for wet snow to over 20:1 for cold dry snow.
How the story developed
- CPC issues its ENSO Diagnostic Discussion: El Niño Advisory, Niño-3.4 at +1.2 °C.
- Forecasters give 81 per cent odds of very strong intensity in this window.
Why this framing matters
This question drives large seasonal search volume and is routinely answered with maps that cannot support an answer. The honest response is to explain the limitation of the product rather than produce a snowfall estimate from a precipitation outlook, and to point the reader at the range where snowfall genuinely becomes predictable.
5 sources reviewed
Every source used in this summary, grouped by its role in the reporting chain.
- 1NOAA Climate Prediction CenterPrimary · 2026-07-09Primary
- 2NOAA Climate.govPrimary · 2026Primary
- 3NOAAPrimary · 2026Primary
- 4International Research Institute for Climate and Society, Columbia UniversityIndependent · 2026Independent
- 5National Weather ServiceIndependent · 2026Independent
How we verified this story
The limitations described are stated properties of NOAA's seasonal precipitation product, taken from NOAA's own material rather than inferred. Current ENSO status comes from the dated CPC diagnostic discussion. No snowfall figure or regional snow estimate appears anywhere in the article, because no source supports one.
Updates and corrections
Preview page created.
Source context and unresolved questions updated.
Related stories and more context
 BUSINESS
AI capex in 2026: the headline totals range from $630bn to $800bn, and the gap is who gets counted
Published estimates for hyperscaler AI spending this year differ by nearly $200 billion. The disagreement is not about the companies' plans — it is about how many companies are in the set, and which baseline year the growth is measured from.
 TECHNOLOGY
Will AI take my job? The measured effect is real, narrow, and concentrated on people under 26
The clearest evidence so far comes from payroll records, not forecasts. It shows a 16 per cent relative employment decline for 22- to 25-year-olds in the most exposed occupations — and growth where AI augments the work instead of replacing it.
 TECHNOLOGY
Which jobs are safe from AI? The dividing line is not the industry — it is whether the work is augmented or automated
The same payroll analysis that found employment falling for early-career workers in exposed occupations found it rising elsewhere. What separates the two is not the sector but how the technology is applied to the task.
Join the discussion
Help build a clearer picture. Add context, challenge a claim or share a source.