El Niño vs La Niña: the difference, the thresholds, and what neither one predicts
They are the warm and cool phases of one Pacific pattern, separated by a defined temperature threshold. The Pacific is in El Niño now, at +1.2 °C. What that shifts is the odds for a season — not the weather on any given day.

El Niño and La Niña are not two separate phenomena. They are the warm and cool phases of a single pattern in the tropical Pacific called the El Niño-Southern Oscillation — ENSO — and the line between them is a defined number rather than a matter of description.
That number is measured in the Niño-3.4 region, a box in the equatorial Pacific between 5°N and 5°S, and between 120°W and 170°W. NOAA tracks how far sea-surface temperature there sits from average. **At least 0.5 °C above average is El Niño. At least 0.5 °C below is La Niña.** In between is ENSO-neutral. To be formally declared rather than merely observed, the departure has to hold for five consecutive overlapping three-month periods.
The cycle shifts back and forth irregularly, roughly every two to seven years. It is not seasonal and it is not on a schedule.
What separates the two phases physically is the trade winds. During La Niña the easterly trades strengthen, pushing warm surface water further west and drawing cool water up in the east. During El Niño they weaken, the warm pool spreads east, and the band of heaviest tropical rainfall shifts with it. Because that rainfall drives atmospheric circulation, moving it moves the jet stream — which is how a temperature anomaly in the mid-Pacific ends up changing the odds of rain in Georgia.
As of the Climate Prediction Center's diagnostic discussion of 9 July 2026, an **El Niño Advisory is in effect**, the most recent weekly Niño-3.4 value was **+1.2 °C**, and forecasters put an 81 per cent chance on the event reaching very strong intensity during October to December, with a 97 per cent chance it persists into early spring 2027.
For the United States, a strong El Niño typically pushes the storm track south: wetter odds across the southern tier from Southern California through the Gulf Coast and Southeast, drier odds across the Pacific Northwest and northern Rockies. La Niña generally reverses it.
Now the part that matters more than any of the above.
**ENSO shifts probabilities across a season. It does not forecast weather.** A region shaded for above-normal precipitation is not being promised a wet winter; it is being told the odds have tilted. A season can land in the unfavoured third of the distribution without the forecast having been wrong. And the pattern says nothing at all about snowfall specifically, because seasonal precipitation maps combine rain and melted snow and cannot separate them.
One practical warning about checking this yourself. While preparing this article, two widely available sources disagreed with NOAA's own advisory. One widely syndicated tracker gave the current Niño-3.4 anomaly as +2.3 °C, nearly double the Climate Prediction Center's +1.2. And NOAA's own general explainer page still carried text stating that La Niña had ended and the Pacific was neutral — accurate when it was written, wrong now.
The dated ENSO Diagnostic Discussion from the Climate Prediction Center is the document that settles it. It is issued monthly, it carries its own date, and it states the alert status outright. Anything that does not tell you when it was written is not telling you what the Pacific is doing today.
Key takeaways
See full context →One pattern, two phases, divided at ±0.5 °C in the Niño-3.4 region — sustained across five overlapping three-month periods.
An El Niño Advisory is active as of the CPC discussion of 9 July 2026, with Niño-3.4 at +1.2 °C.
ENSO tilts seasonal odds and says nothing about snowfall or any individual day's weather.
Source map
Explore all sources →✓What we know
- El Niño and La Niña are the warm and cool phases of one pattern, the El Niño-Southern Oscillation.
- The threshold is ±0.5 °C from average in the Niño-3.4 region, between 5°N-5°S and 120°W-170°W.
- A formal declaration requires the departure to persist for five consecutive overlapping three-month periods.
- The cycle recurs irregularly every two to seven years and is not seasonal.
- As of the CPC discussion dated 9 July 2026, an El Niño Advisory is in effect with Niño-3.4 at +1.2 °C.
- Forecasters give an 81 per cent chance of very strong intensity in October-December and 97 per cent persistence into early spring 2027.
?What remains unclear
See full context- ENSO shifts seasonal probabilities and does not forecast individual storms or any given day.
- Seasonal precipitation outlooks combine rain and melted snow, so ENSO phase does not predict snowfall.
- A season can fall outside the favoured range without the forecast being wrong, because the maps express odds rather than outcomes.
- How strong this event ultimately becomes is given as a probability, not a determined value.
- Regional effects described as typical are tendencies across past events, not guarantees for this one.
Every factual claim, and what supports it
Each statement in this article is listed with how it is classified and which of the sources below establish it. A verified fact is corroborated by two or more independent sources; a reported claim rests on fewer, or on a single party’s account.
El Niño and La Niña are the warm and cool phases of the El Niño-Southern Oscillation.
NOAA's own definition, corroborated in independent reference material.The threshold is at least 0.5 °C above or below average in the Niño-3.4 region.
Threshold stated by NOAA and consistent across sources.The Niño-3.4 region spans 5°N to 5°S and 120°W to 170°W.
Region boundaries as defined by NOAA.A formal declaration requires five consecutive overlapping three-month periods above threshold.
Persistence criterion stated by NOAA.The cycle recurs irregularly every two to seven years.
Recurrence interval given by NOAA.An El Niño Advisory was in effect as of the CPC diagnostic discussion dated 9 July 2026.
Alert status stated in the dated official discussion.The most recent weekly Niño-3.4 value in that discussion was +1.2 °C.
Figure from the CPC discussion; a third-party tracker gave +2.3 °C, which the official document does not support.A strong El Niño typically shifts the US storm track south, favouring a wetter southern tier and a drier Pacific Northwest.
Typical tendency across past events, not a forecast for this one.Seasonal outlooks combine rain and melted snow and therefore cannot predict snowfall.
Stated limitation of the seasonal precipitation product.NOAA's general ENSO explainer page carried text describing the Pacific as neutral while the CPC advisory recorded El Niño.
The two NOAA pages disagreed at time of access. The dated advisory is treated as authoritative; the discrepancy is reported rather than resolved silently.Forecasters gave 81 per cent for very strong intensity in October-December and 97 per cent persistence into early spring 2027.
Probabilities stated in the CPC diagnostic discussion.A syndicated ENSO tracker reported the Niño-3.4 anomaly as +2.3 °C, against the CPC's +1.2 °C.
The two figures conflict. The dated official discussion is treated as authoritative and the discrepancy is reported.
How the story developed
- CPC issues its ENSO Diagnostic Discussion: El Niño Advisory, Niño-3.4 at +1.2 °C.
- The seasonal winter outlook is issued, giving 81 per cent for very strong intensity in October-December.
- The window in which forecasters expect the event to reach its greatest intensity.
- El Niño is given a 97 per cent chance of persisting into early spring.
Why this framing matters
Most explainers of this topic describe the two phases and stop, which leaves the reader thinking ENSO forecasts weather. It does not; it moves seasonal odds, and the distinction is where nearly all public confusion sits. The article also documents a live sourcing problem found while writing it: three accessible sources, including a page on NOAA's own site, disagreed with the current dated advisory. That is reported because it changes how a reader should check this for themselves.
6 sources reviewed
Every source used in this summary, grouped by its role in the reporting chain.
- 1NOAA Climate Prediction CenterPrimary · 2026-07-09Primary
- 2NOAA Climate.govPrimary · 2026Primary
- 3NOAAPrimary · 2026Primary
- 4International Research Institute for Climate and Society, Columbia UniversityIndependent · 2026Independent
- 5MapprIndependent · 2026-08Independent
- 6NOAA Climate Prediction Center — ENSO evolution and predictionsIndependent · 2026-07Independent
How we verified this story
Definitions, the Niño-3.4 boundaries and the ±0.5 °C threshold are taken from NOAA's own ENSO explainer. Current status and all probabilities come from the Climate Prediction Center's dated ENSO Diagnostic Discussion of 9 July 2026, in preference to third-party trackers, two of which gave figures that conflict with it. NOAA's general explainer page carried stale status text at the time of access; that conflict is reported in the article rather than silently resolved, because a reader following the same path would hit it. No snowfall claim is made, since seasonal outlooks cannot support one.
Updates and corrections
Preview page created.
Source context and unresolved questions updated.
Related stories and more context
 BUSINESS
AI capex in 2026: the headline totals range from $630bn to $800bn, and the gap is who gets counted
Published estimates for hyperscaler AI spending this year differ by nearly $200 billion. The disagreement is not about the companies' plans — it is about how many companies are in the set, and which baseline year the growth is measured from.
 SCIENCE
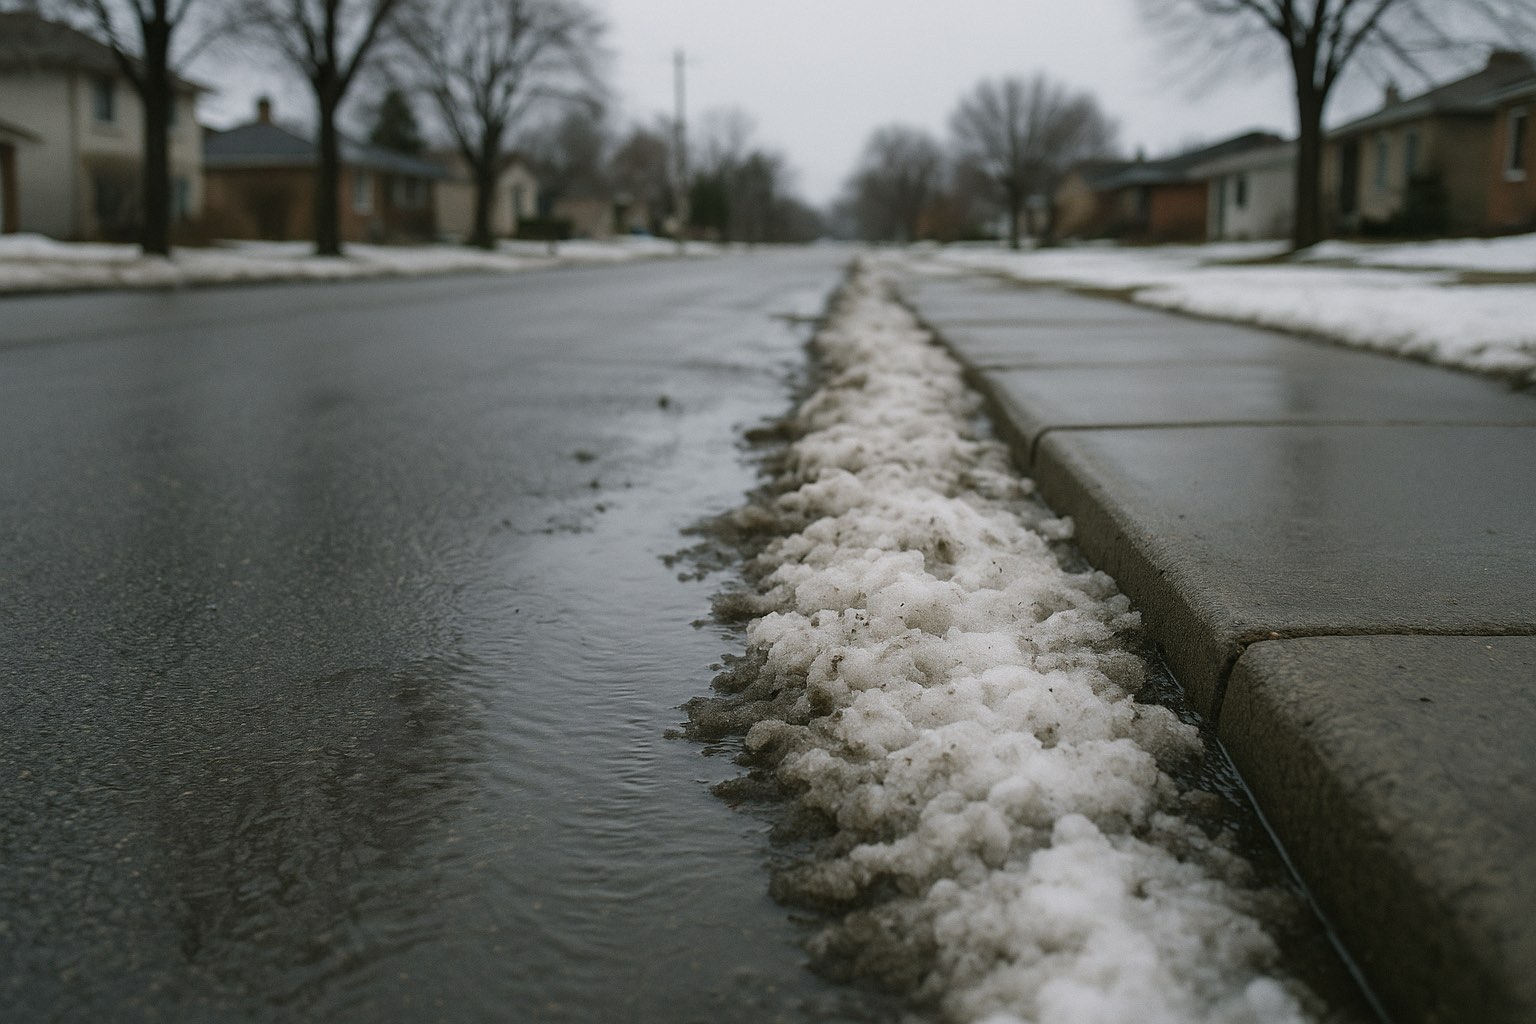
Does El Niño mean more snow? Seasonal outlooks cannot answer that, and here is why
The maps people check for a snow answer measure precipitation, which combines rain and melted snow into one number. They cannot separate the two. That is a built-in limitation of the product, not a gap someone forgot to fill.
 TECHNOLOGY
Will AI take my job? The measured effect is real, narrow, and concentrated on people under 26
The clearest evidence so far comes from payroll records, not forecasts. It shows a 16 per cent relative employment decline for 22- to 25-year-olds in the most exposed occupations — and growth where AI augments the work instead of replacing it.
Join the discussion
Help build a clearer picture. Add context, challenge a claim or share a source.