How much water does ChatGPT use? The researcher behind the famous number has revised it
The figure everyone repeats — roughly a bottle of water per email — came from a 2024 estimate its own author now calls outdated. His revised number is about 35 times smaller, and Google's published figure is smaller still. Almost all of the gap is what each one counts.
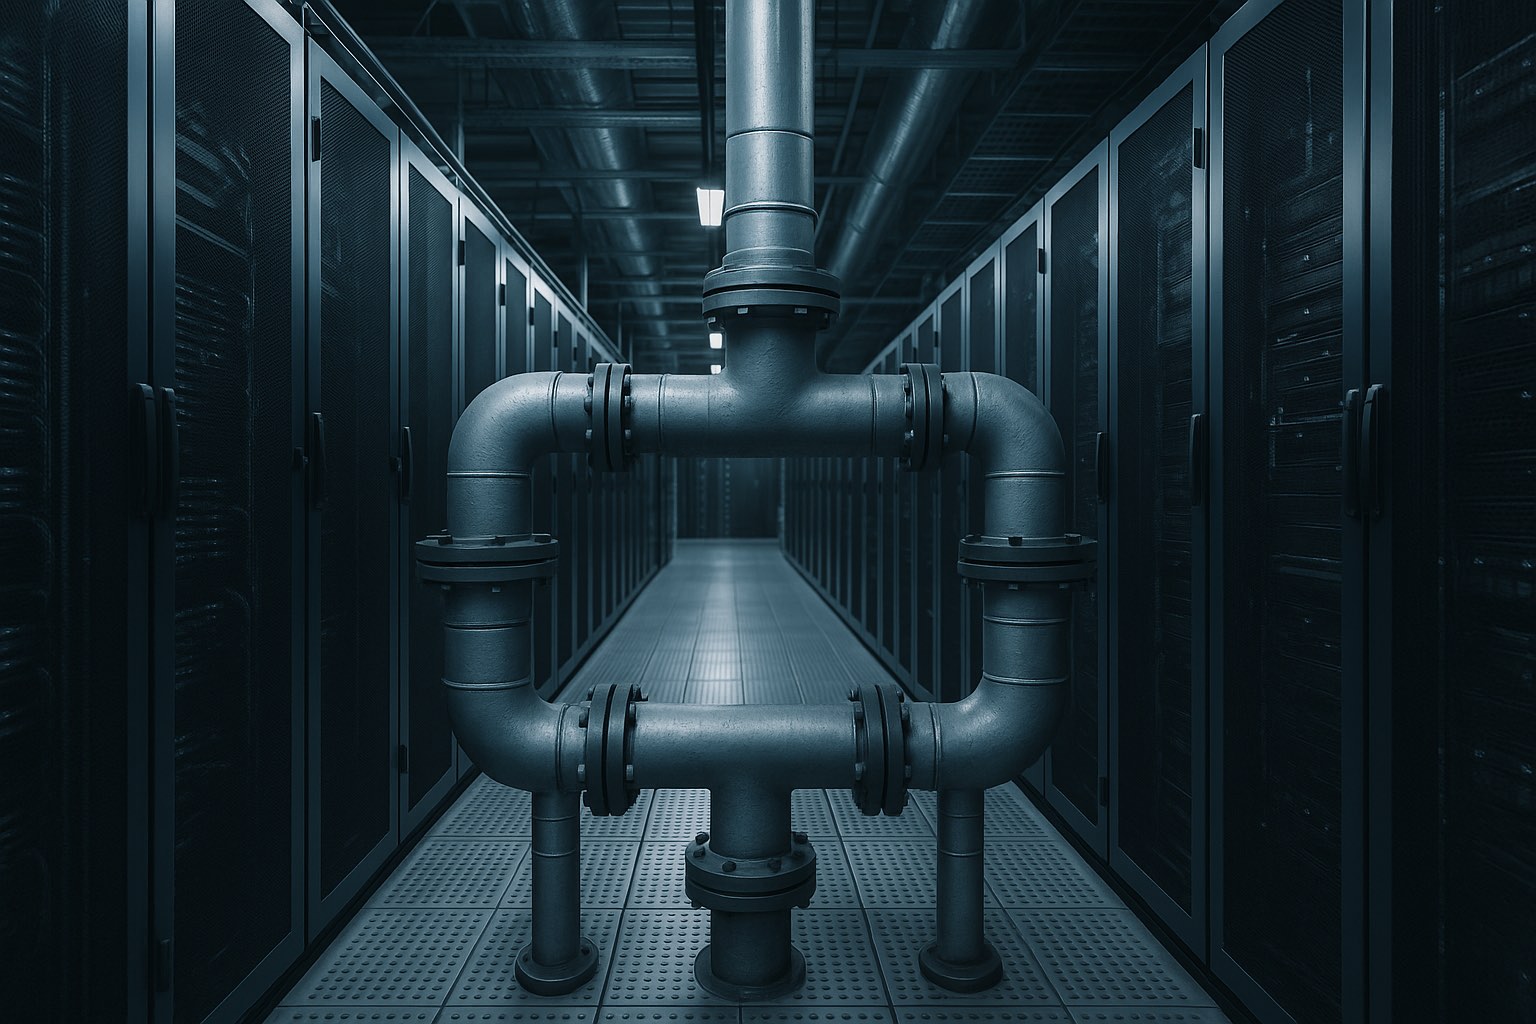
If you have seen a number for how much water ChatGPT uses, it was probably around half a litre — a bottle of water for a single email. That figure is real, it came from serious researchers, and the person behind it no longer stands by it.
Here is where it came from. In 2024, The Washington Post worked with researchers at the University of California, Riverside to estimate the water cost of generative AI. Their model put GPT-4 producing a 100-word email at an average US data centre at **519 millilitres**. That number counted two things: the water evaporated to cool the servers, and the water consumed at power plants generating the electricity those servers used.
It travelled. It became the standard citation, usually stripped of its conditions and restated as a bottle of water per prompt.
Shaolei Ren, the UC Riverside researcher whose team produced it, has since revised the estimate to roughly **15 millilitres** for a GPT-4 prompt, of which about 5 millilitres is on-site cooling. He describes the original figure as outdated for today's systems. That is a reduction of roughly thirty-five fold, and it has not travelled anywhere near as far as the original did.
Then there is Google's own number. In August 2025 Google published a technical paper measuring its production systems and reported that the median Gemini text prompt consumes **0.26 millilitres** of water — about five drops — alongside 0.24 watt-hours of energy.
So the published figures span from 519 millilitres to 0.26. That looks like a scientific dispute. It mostly is not.
The numbers differ on three separate axes, and comparing them directly gets all three wrong.
**They measure different things.** 519 ml was for a 100-word email — many prompts' worth of output. Google's 0.26 ml is a single median text prompt. These are not the same unit.
**They count different water.** The UC Riverside estimate is all-in: cooling water plus the water consumed generating the electricity. Google's figure counts only water used in its data centres for cooling, and excludes the water consumed by the power plants supplying them. Ren's own revised split makes the size of that gap visible — about 5 ml of his 15 ml is cooling; the rest is upstream.
**They describe different infrastructure.** A 2024 estimate of an average US data centre and a 2025 measurement of Google's own fleet are not describing the same buildings. Efficiency has moved, and Google is measuring hardware it designed.
One further caveat belongs on Google's figure specifically: it is self-reported by the company whose environmental footprint is in question, drawn from systems no outside party can independently measure. That does not make it wrong. It does make it a company disclosure rather than an independent finding, and it should be read as one.
What can be said with confidence is narrower than either camp's headline. The per-prompt water cost of a text query is small — millilitres, not litres — under every current published estimate including the revised one from the researcher who produced the original. The widely circulated bottle-of-water figure overstates a single prompt by a wide margin, and its own author says so.
None of which settles the question people are actually arguing about. Per-prompt figures say nothing about aggregate demand, and nothing at all about where the water is drawn from. A data centre with a modest per-query footprint sited in a water-stressed county is a local problem regardless of how the arithmetic divides out per prompt. That is a question about siting, permitting and regional supply, and it is not answered by any of the three numbers above.
Key takeaways
See full context →The widely cited 519 ml figure was for a 100-word email on 2024 infrastructure, counting cooling plus power-generation water. Its author has revised it to about 15 ml per prompt.
Google's published median Gemini prompt is 0.26 ml, but counts only data-centre cooling and is self-reported.
Per-prompt figures say nothing about aggregate demand or where water is withdrawn — the siting question is separate and unresolved.
Source map
Explore all sources →✓What we know
- A 2024 Washington Post and UC Riverside estimate put GPT-4 producing a 100-word email at 519 ml, counting cooling water and water consumed generating the electricity.
- Shaolei Ren of UC Riverside has revised the estimate to about 15 ml per GPT-4 prompt, roughly 5 ml of which is on-site cooling, and calls the original outdated for current systems.
- Google reported in August 2025 that its median Gemini text prompt uses 0.26 ml of water and 0.24 watt-hours of energy.
- Google's figure counts only data-centre cooling water and excludes water consumed by the power plants supplying its facilities.
- The underlying peer-reviewed work is 'Making AI Less Thirsty' by Pengfei Li, Shaolei Ren and colleagues at UC Riverside.
?What remains unclear
See full context- Google's figure is self-reported and cannot be independently verified by outside parties.
- OpenAI has not published a comparable per-prompt water figure for ChatGPT, so no company-reported number exists for the model most people are asking about.
- Aggregate water withdrawal by AI infrastructure is not established by any per-prompt figure and estimates vary widely.
- Where water is withdrawn — and whether local supply is stressed — is a siting question that per-prompt arithmetic does not address.
- How much the revised 15 ml figure varies by data centre location, cooling design and season is not stated.
Every factual claim, and what supports it
Each statement in this article is listed with how it is classified and which of the sources below establish it. A verified fact is corroborated by two or more independent sources; a reported claim rests on fewer, or on a single party’s account.
A 2024 Washington Post and UC Riverside estimate put GPT-4 producing a 100-word email at 519 ml of water.
Widely documented figure with its original conditions: 100-word email, average US data centre.That estimate counted both on-site cooling water and water consumed generating the electricity used.
Scope stated in the original methodology.Shaolei Ren has revised the estimate to about 15 ml per GPT-4 prompt, roughly 5 ml of it on-site cooling.
Revision attributed to the original researcher; reported independently by more than one outlet.Ren describes the original figure as outdated for current systems.
Characterisation attributed to Ren.Google reported a median Gemini text prompt at 0.26 ml of water and 0.24 watt-hours in August 2025.
Published by Google in a technical paper and reported independently.Google's figure counts only data-centre cooling water and excludes power-generation water.
Scope limitation stated in coverage of the paper and central to why the figures differ.The underlying peer-reviewed paper is 'Making AI Less Thirsty' by Li, Ren and colleagues at UC Riverside.
Publication of record for the original methodology.OpenAI has not published a comparable per-prompt water figure for ChatGPT.
No company-reported figure was located; stated as an absence rather than a finding.
How the story developed
- The Washington Post and UC Riverside estimate 519 ml for a 100-word GPT-4 email at an average US data centre.
- 'Making AI Less Thirsty' is published in Communications of the ACM by Li, Ren and colleagues.
- Google publishes a technical paper reporting 0.26 ml and 0.24 Wh for a median Gemini text prompt.
- Shaolei Ren revises the per-prompt estimate to about 15 ml and describes the original as outdated.
Why this framing matters
This is a question where the most-repeated number and the best-supported number are not the same, and the correction came from the original author rather than from a critic. The reliable way to get it wrong is to line the figures up as though they disagree about physics; they mostly disagree about scope and unit. The article states the range, explains the three axes the figures differ on, and stops short of the conclusion that low per-prompt figures make AI water use a non-issue — that does not follow, and the siting question is where the real dispute sits.
6 sources reviewed
Every source used in this summary, grouped by its role in the reporting chain.
- 1The Washington PostPrimary · 2024-09-18Primary
- 2Communications of the ACMPrimary · 2025Primary
- 3Data Center DynamicsIndependent · 2025-08Independent
- 4DiggIndependent · 2026Independent
- 5AI WeeklyIndependent · 2026Independent
- 6ForbesIndependent · 2026-07-21Independent
How we verified this story
Every figure is given with its unit, its scope and the infrastructure it describes, because the confusion in public coverage comes almost entirely from stripping those conditions. Google's number is labelled as a company self-disclosure rather than an independent measurement. Ren's revision is reported as the original author's own correction, which is what makes it load-bearing. No aggregate or national water figure is given, because the per-prompt sources do not support one and the estimates that do exist vary too widely to state as fact.
Updates and corrections
Preview page created.
Source context and unresolved questions updated.
Related stories and more context
 BUSINESS
AI capex in 2026: the headline totals range from $630bn to $800bn, and the gap is who gets counted
Published estimates for hyperscaler AI spending this year differ by nearly $200 billion. The disagreement is not about the companies' plans — it is about how many companies are in the set, and which baseline year the growth is measured from.
 SCIENCE
Does El Niño mean more snow? Seasonal outlooks cannot answer that, and here is why
The maps people check for a snow answer measure precipitation, which combines rain and melted snow into one number. They cannot separate the two. That is a built-in limitation of the product, not a gap someone forgot to fill.
 TECHNOLOGY
Will AI take my job? The measured effect is real, narrow, and concentrated on people under 26
The clearest evidence so far comes from payroll records, not forecasts. It shows a 16 per cent relative employment decline for 22- to 25-year-olds in the most exposed occupations — and growth where AI augments the work instead of replacing it.
Join the discussion
Help build a clearer picture. Add context, challenge a claim or share a source.